Data mining from Social Media
Simple counts and averages can take us so far, but what if we're interested in deeper insights into our data?
In our previous article on analysing social media data we’ve discussed some basic methods to draw conclusions of social media data. Simple counts and averages can take us so far, but what if we’re interested in deeper insights into our data?
Total Engagement
Engagament metrics are easy to understand and are a great starting point to analyse. The whole point of being on social media is to reach an audidence, and what validates interest in our content more than how many users shared our posts?
Still a simple count, but focused on the number of engagement (that is, favourites or retweets in Twitter, or it can be the number of likes on Facebook).
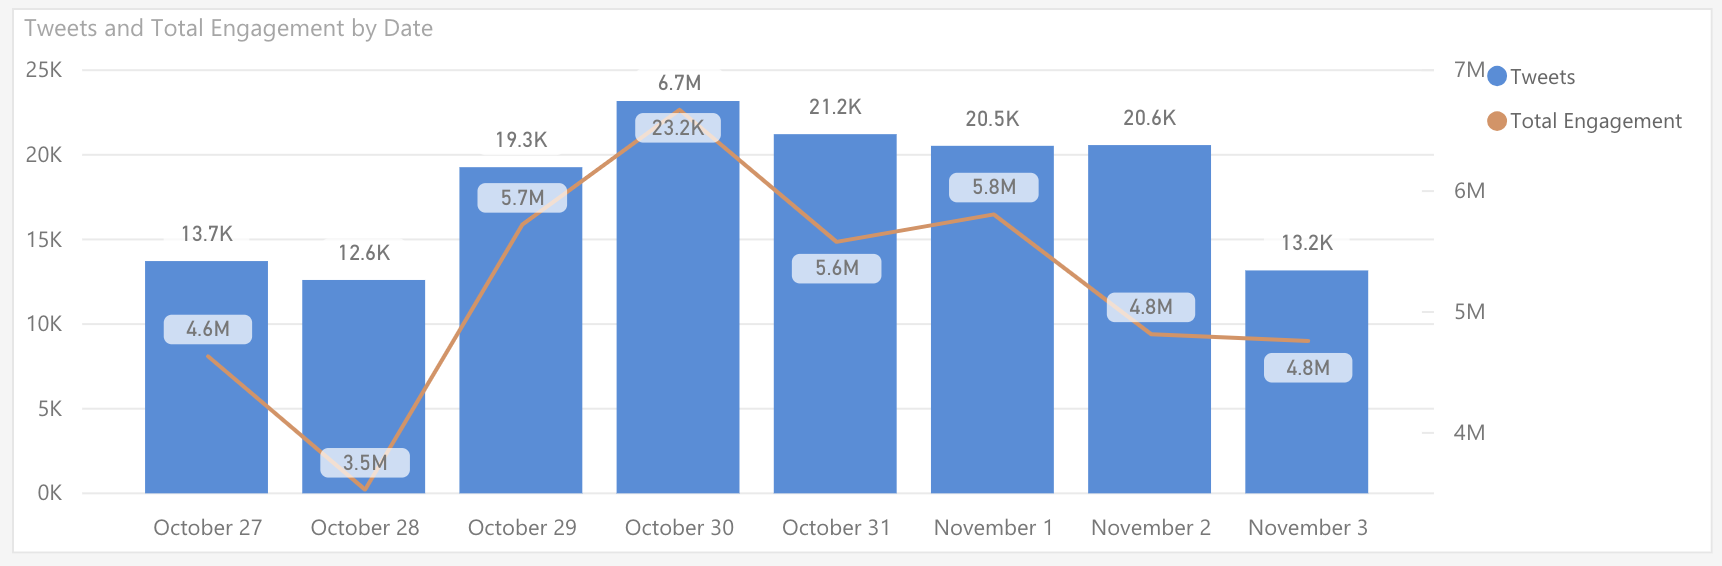
Once we create a visualisation like the one above we can immediately draw conclusions from the ratio between posts and their total engagement. We can see that on average we captured posts in the range of tens of thousands per day, but their total engagent was in the range of millions.
Once content is filtered further by topics, for example, total engagement can be quite telling about the importance of the posts to our audience.
Details of Engagement
Another useful metric is the breakdown of the various engagement activities.
On Twitter, we can establish the number of favourites, retweets and quote tweets. If someone retweeted a post it can be thought as a stronger indicator of interest than if it was favourited because a retweet appears on the user’s timeline. A quote tweet however, shows an even greater level of interest (that can mean appreciation) because the user writes some additional comment to the original tweet.
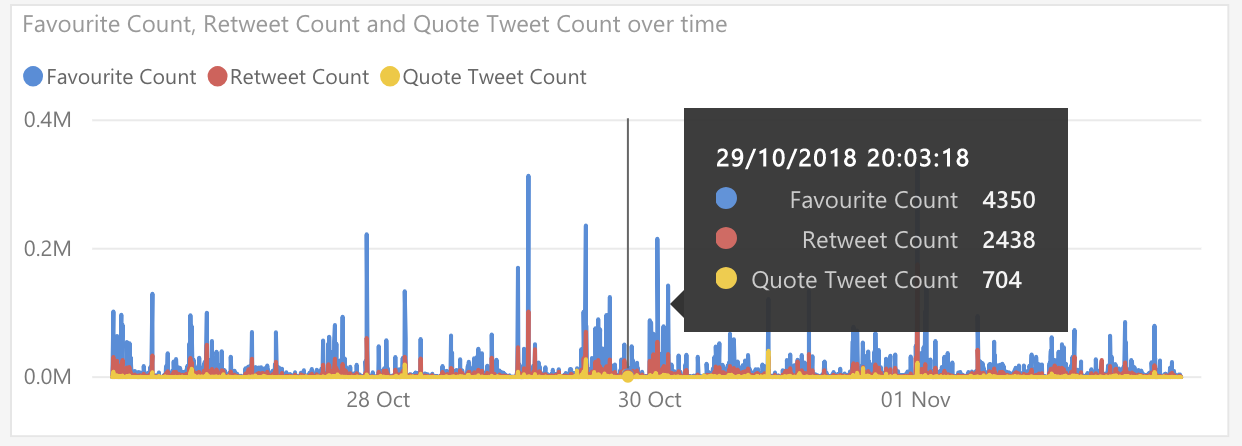
On Facebook, likes and shares tell us similar level of interest as favourites and retweets on Twitter.
Viewing engagement activities in a time-series plot, like the one presented, reveals valuable information if used with some context. For example, posts can be filtered by certain hashtags or topics, and then the detailed number of engagements can be plotted as they occurred on a time-series plot. Trends can be seen immediately, and high or low engagement periods can be identified.
Trending hashtags
Hashtags are part of all major social networks, such as Twitter or LinkedIn.
Hashtags are a great way to tag posts and assign a topic to them. Therefore, hashtags reveal the intented category of the posts put on social media.
Hashtags also create a link between different posts. The more posts share the same hashtags, it can reveal the popularity of certain topics.
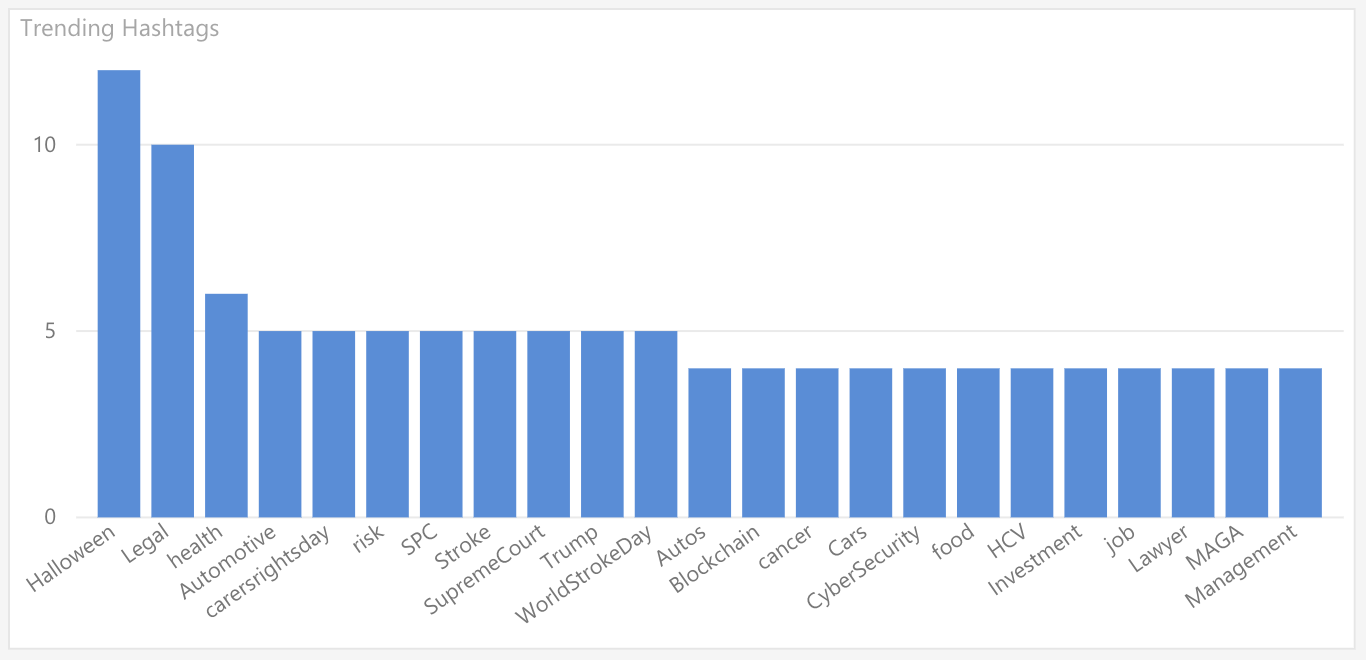
Trending hashtags are a great way to measure the interest of the community. Like news, the usage of different hashtags fluctuate over time depending on how popular the topics they represent. For example, a business that sells car insurance can analyse the popularity of hashtags associated with cars and safety.
Depending on the initial filter criteria, the trending hashtags could reveal quite a different result than initially expected. However, this is the point of the data analysis task: to reveal real information and trends instead of depending on assumptions.
The screenshots in the article were taken from Social Media Analytics dashboards built by Segence.
Contact us to ask questions or if you’d like to get some insights into social media for your business.